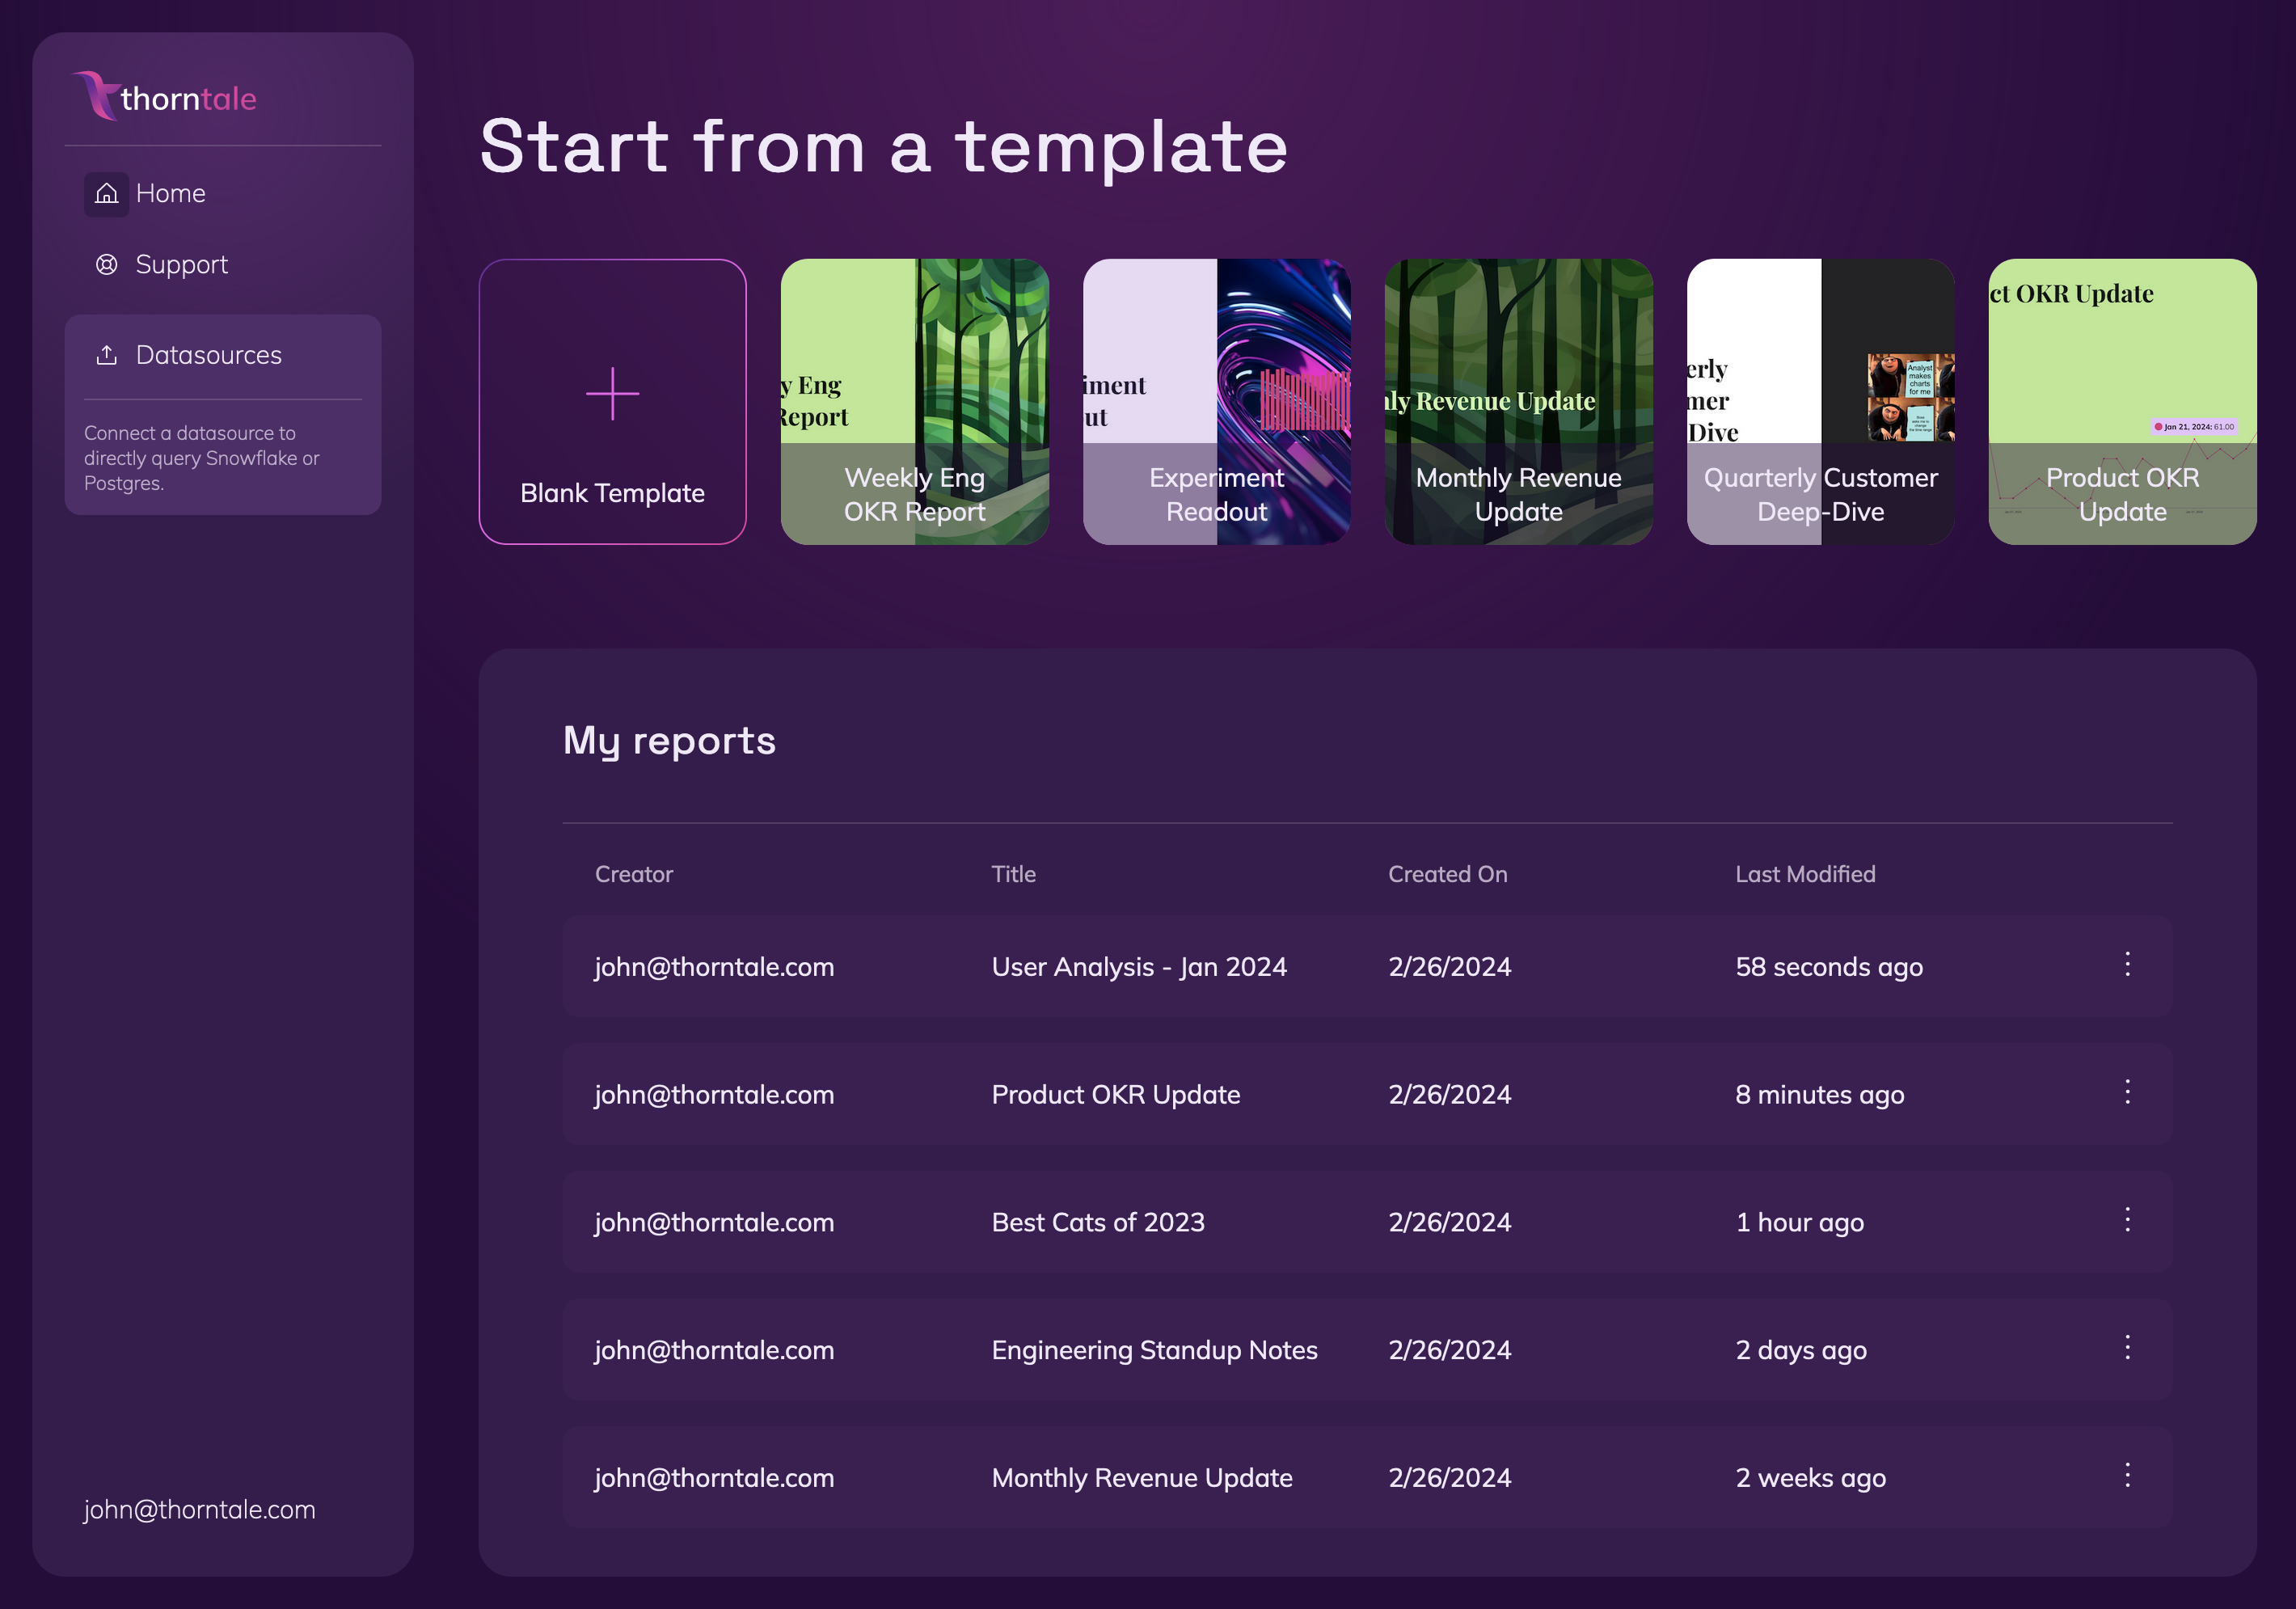
The world's best presentation editor, powered by AI.
TL;DR: We’re building software that makes it fast and easy to create persuasive decks with your data. Thorntale connects live to any data source, so you always have pretty, interactive, and up-to-date charts. Our opinionated templates are made explicitly for product, data, and engineering teams, so you don’t have to start from scratch. Try the beta here!
Hey y’all, we’re Dori, Ellen, and John, the team behind thorntale. We’re building the software we wish we had in our pre-founder days.
❌ The Problem: Communicating data is hard. Current tools make it harder.
Companies invest heavily in data teams and advanced tooling but still struggle to incorporate their work into decision-making. We believe this is due to where these findings get communicated: the presentation. Existing presentation tools do not integrate with the rest of the data stack, so instead people screenshot charts and copy-paste tables into their decks. This creates situations where data is miscommunicated, missing, or inaccurate.
🌟 Our Solution: Presentation software that integrates with your data stack.
By connecting live data to your presentations and starting from professionally curated templates, presentations in thorntale aren’t just pretty, they’re functional. We create charts in-app that match your presentation’s theme, so you can focus on telling a persuasive story instead of formatting. Using thorntale, you’ll save time and make better business decisions.
🧩 Who We Are
from left to right:
Ellen: Backend & Infrastructure. Previously big data at Microsoft, SRE at Cruise, distributed systems, and real-time video at Mux.
John: Frontend, backend, & data engineer. Worked on big data at Yelp, and most recently did data engineering at Clockwise.
Dori: Data Scientist turned CEO. Crafted data stories at Uber, CircleCi, Mux, Pave, and the Federal Reserve Bank of San Francisco.
🙏 Our Ask: Try us!
- Try us out! We’re improving the product every day, and want to know what you think! Get Started.
- If you’re a business, we’re more than happy to build custom templates and make documents using your branding. Book time with us.
- Connect us with the people in your life who regularly make presentations using data by sharing this post or emailing founders@thorntale.com.
Send any questions, inquiries, or pretty charts our way at founders@thorntale.com.


