Dashdive — Break down cloud costs by feature and customer
The only tool that shows per-feature and per-customer cloud costs.
Dashdive attributes AWS, GCP, Azure and other cloud services costs to features, products, teams and customers. These data help companies understand how their profitability breaks down by product and customer, allowing them to make optimal strategic decisions about pricing, resource allocation and cloud architecture.
Problem
Most tech companies don’t know how much it costs to serve each of their customers with each of their products. Cloud costs are typically a tech company’s second-largest cost (after personnel), and they can vary significantly even on a per-unit basis, i.e. irrespective of volume.
Without per-customer and per-product cost information, companies can’t reliably know:
- What’s our margin on Customer A?
- What’s our margin on Product B?
- Which usage events drove Customer C’s costs last month?
- What are our costs likely to be on new Customer D?
Normally, if an engineering or finance team wants to know the answer to one of these questions, they have to either 1) make an estimate that could be wildly inaccurate based on average total costs or 2) “track down an engineer to run experiments in AWS.” (That was a direct quote from a CFO.)
Solution
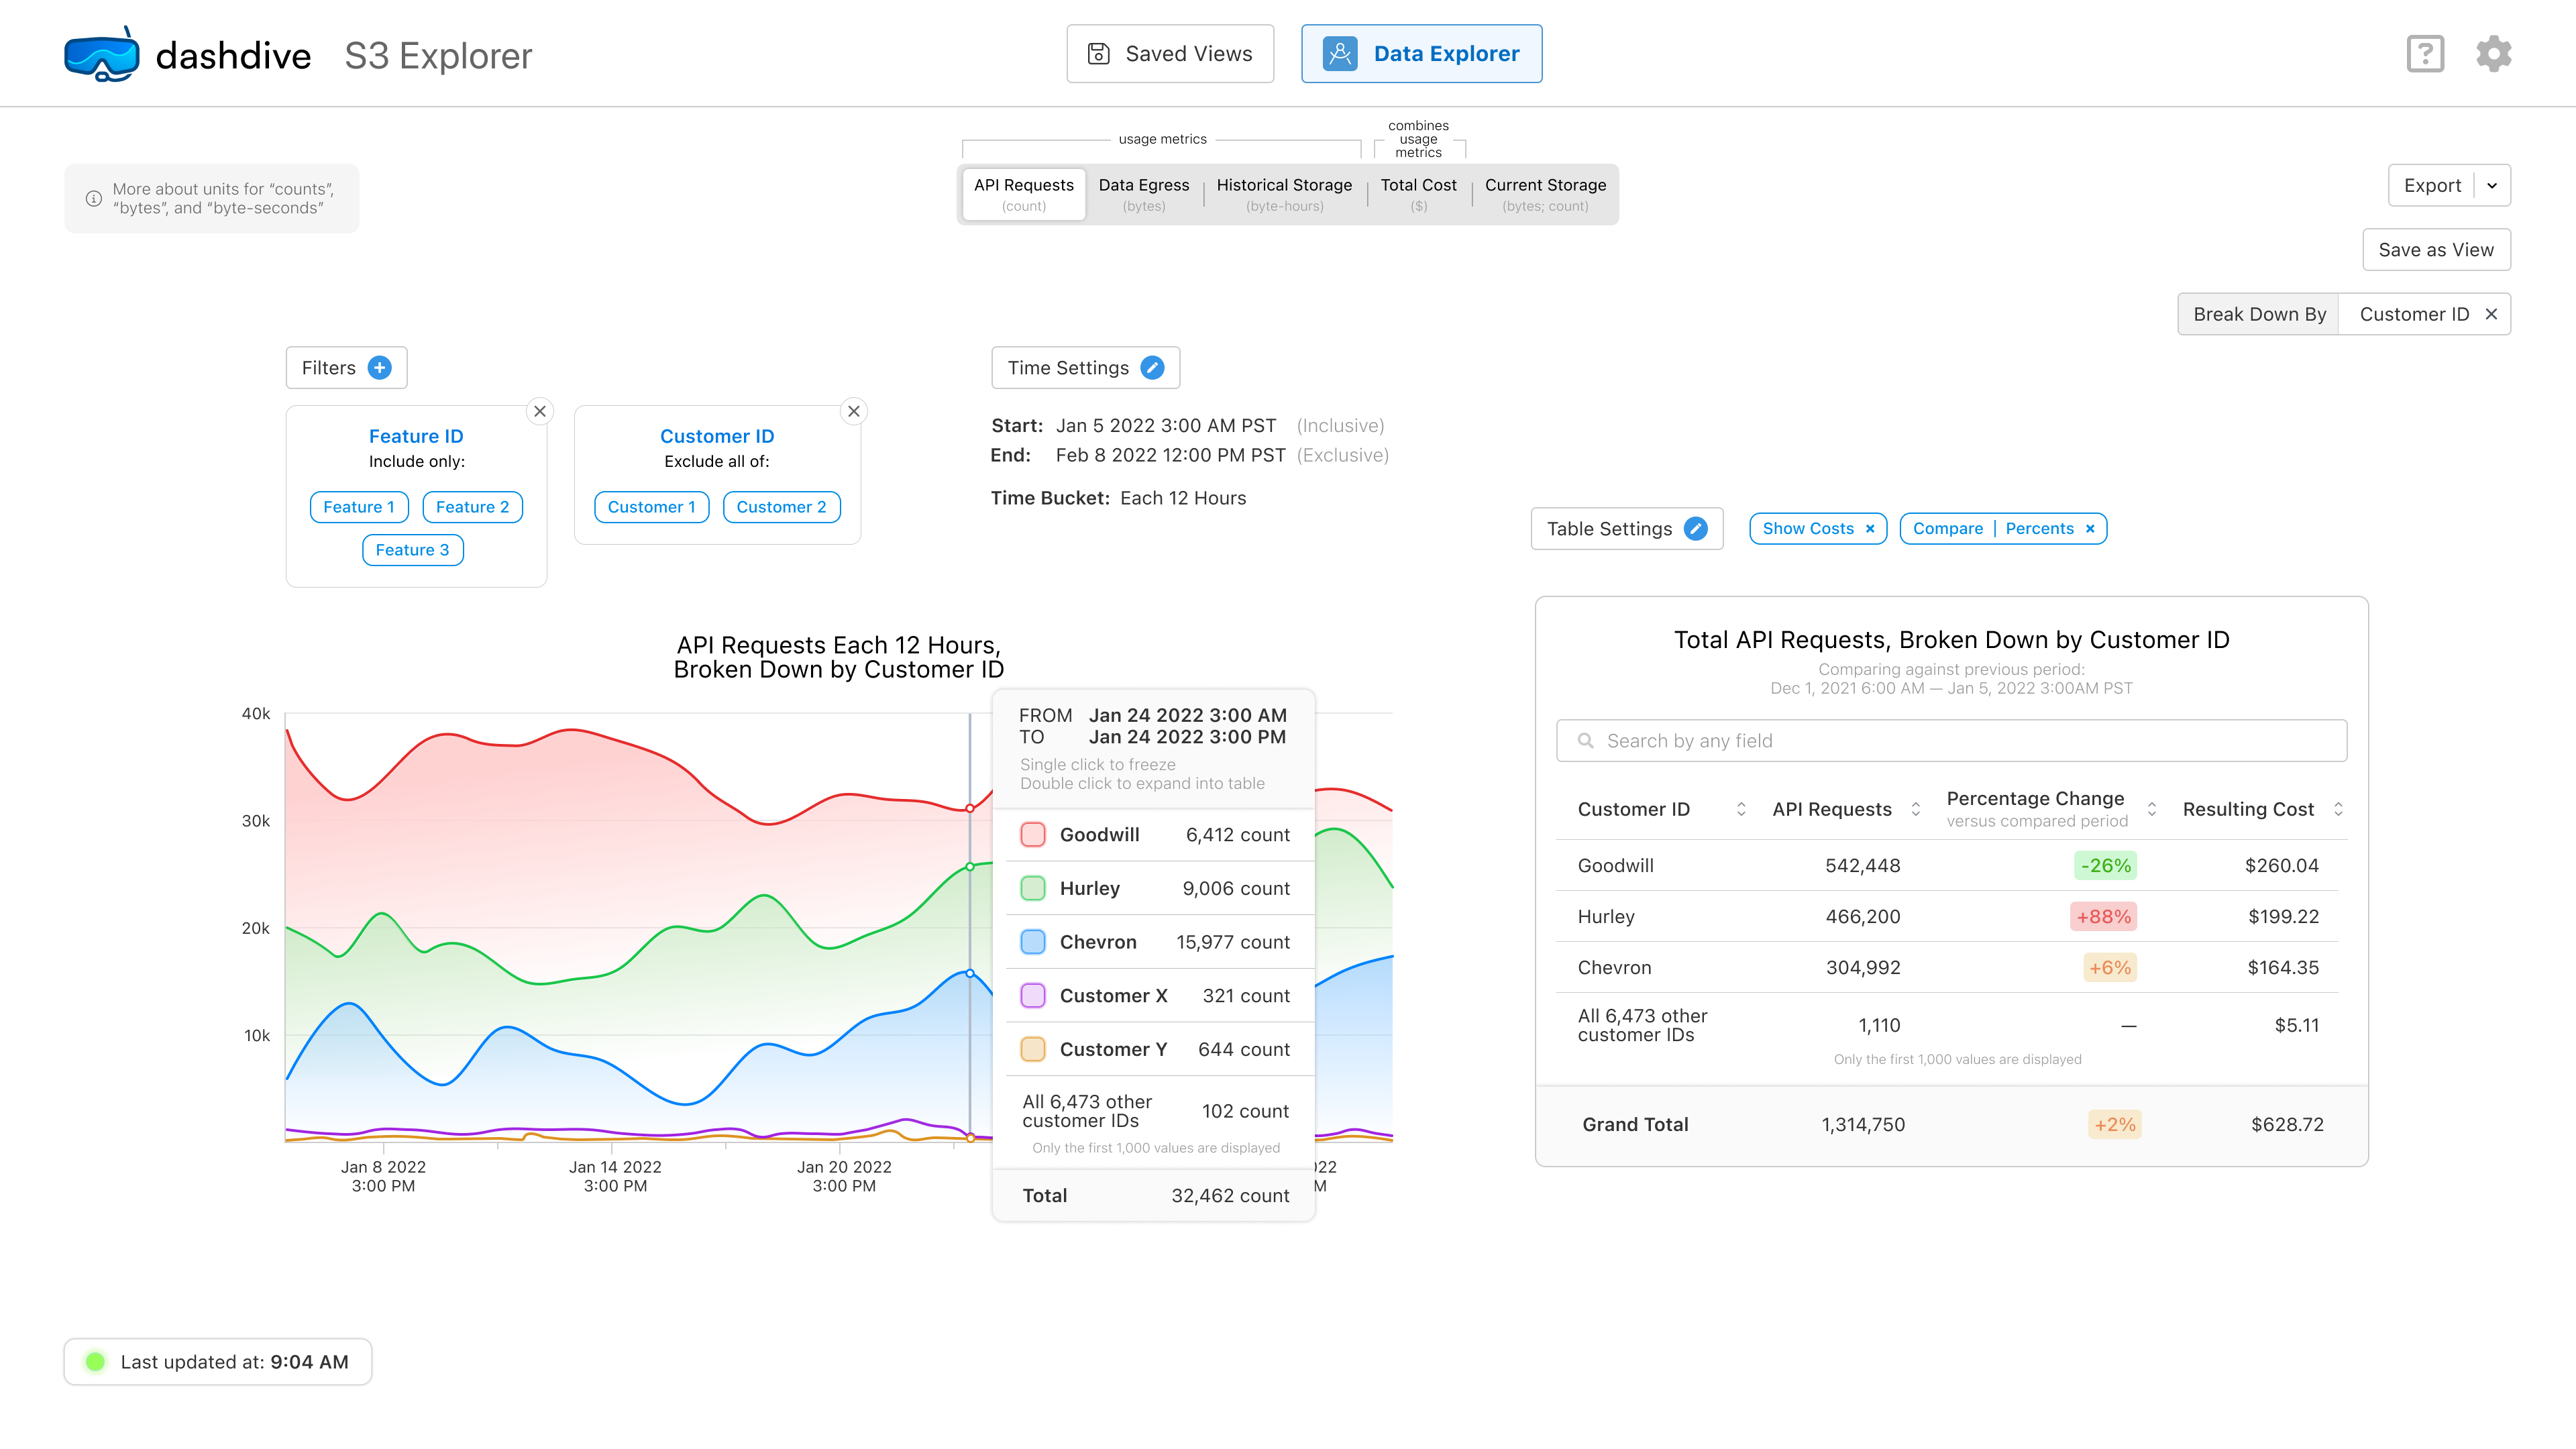
Dashdive answers these questions by monitoring backend services (servers, databases, etc.) with lightweight agents. These agents attribute the activity on each cloud service to specific features and customers using distributed tracing and continuous profiling. Then, the usage data are mapped to cost data via AWS/GCP/Azure billing APIs. The result is a complete picture of who and what are driving cloud costs over time.
Granular cloud cost data allow companies to:
- Know if they’re pricing an existing customer too low—or below cost.
- Hone in on individual lines of code and architectural decisions that incur disproportionate costs. (Other tools can only give generic cost-cutting recommendations based on total costs, e.g. “consider reserving storage in advance for a discount,” since they just repackage existing AWS billing data.)
- Give customers who complain about high bills or opaque pricing an adequate explanation (and perhaps even suggested usage patterns to reduce future bills).
- Better forecast the cost of serving a new customer based on expected usage. This helps teams price contracts optimally to hit margin goals consistently.
Setup
Installation only involves deploying Dashdive agents to each service of interest. This takes five minutes and requires zero code changes. Although our backend is cloud-based by default, Dashdive can be self-hosted for companies that need to keep all data within their ecosystem.
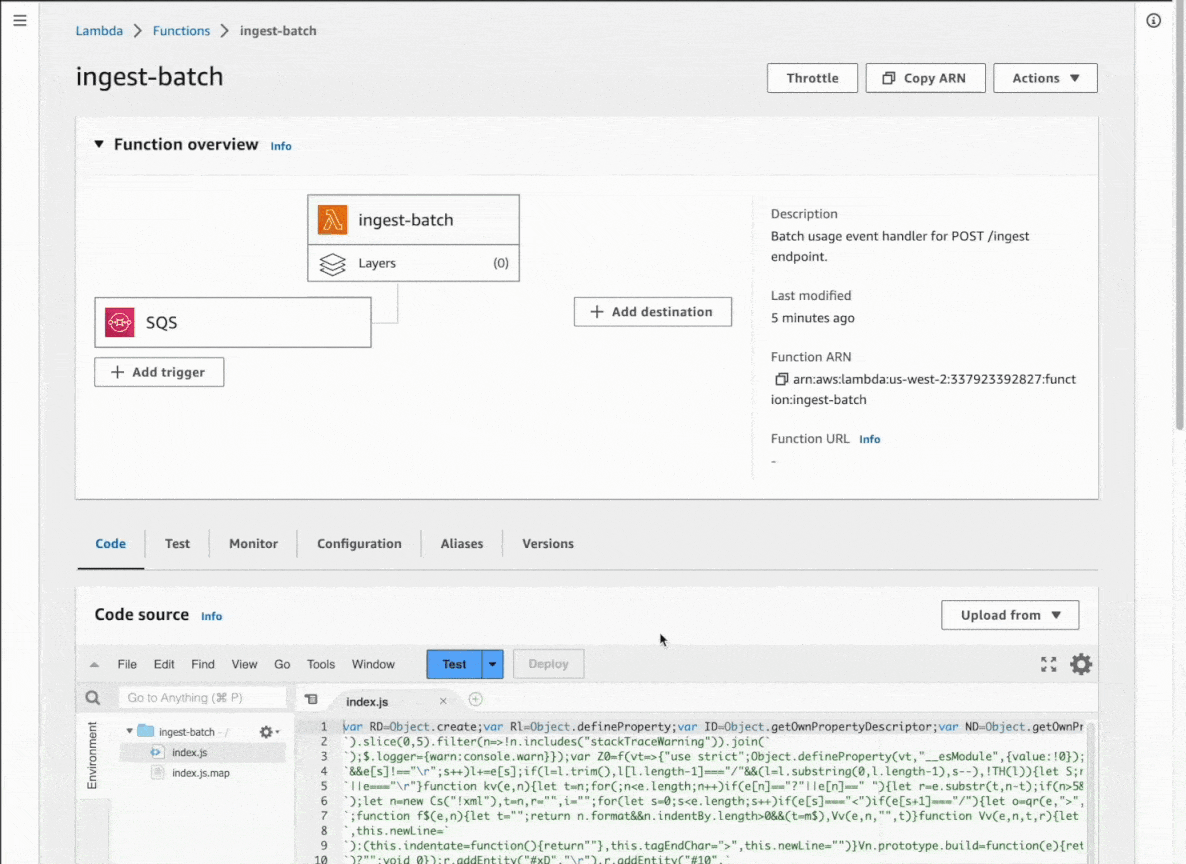
This is the entire setup for AWS Lambda, a popular cloud service.
Why Now
Supply and demand factors make now the perfect time to launch this product:
- Supply: Monitoring technologies eBPF and OpenTelemetry have come a long way in the past few years. Both technologies allow seamless monitoring of different technology stacks, removing friction where engineering teams would have otherwise needed to make significant investments in setup and maintenance. Application performance monitoring companies like Datadog have proven that monitoring dozens of services is technically feasible and can be profitable even at scale.
- Demand: As the cost of capital has increased and fundraising has become less certain, profitability is the only way to guarantee business survival. Business and engineering leaders are placing newfound importance on margin health.
Given these factors, this opportunity emerged in the last twelve months.
Get in Touch
More information at dashdive.com. Inquiries can be sent to team@dashdive.com.

Dashdive’s founders met in college at Stanford University. Bringing strategy and sales experience, Micah (left) worked at the Boston Consulting Group. Adam (right) developed his engineering background at Palantir and Apple.