DSensei - Pinpoint the root cause of metric fluctuations in one minute
An AI-powered key driver analysis engine
TL;DR:
DSensei is an AI-powered key driver analysis engine that can pinpoint the root cause of metric fluctuations within one minute. We save data teams hours to days of manual work on root cause analysis and help organizations uncover critical drivers and segments that are otherwise easy to overlook. A similar tool is being used at Meta to diagnose key metrics changes, such as revenue and DAU, and we are making it available for all businesses.
The Team:

We are Yulong and Daiyi, we have known each other for 18 years, since college. Prior to DSensei, Yulong worked as a machine learning engineering manager at Snapchat. Daiyi was an Uber TL at Meta leading multiple teams. We both have a strong background in tech infrastructure, and machine learning, and extensive hands-on experience in building products.
Problem:
Existing business intelligence (BI) tools excel at presenting the current state (“What”) and the fluctuation history (“How”) in key metrics like daily active users (DAU), revenue, session time, etc. However, they fall short when it comes to providing insights into the underlying reasons behind fluctuations ("why").
In today's data-driven world, the ability to comprehend the causes of metric fluctuations and take appropriate actions based on those insights in a timely manner is critical to business success. A lot of times even minor changes in overall metrics may be connected to significant shifts in specific segments. However, current BI tools do not provide an efficient way of understanding the “why” behind a metric fluctuation. As a result, manual work is required to examine the numerous segments under the metric using various slice-and-dice queries followed by a custom script to sort and summarize, which often takes hours or even days of manual work.
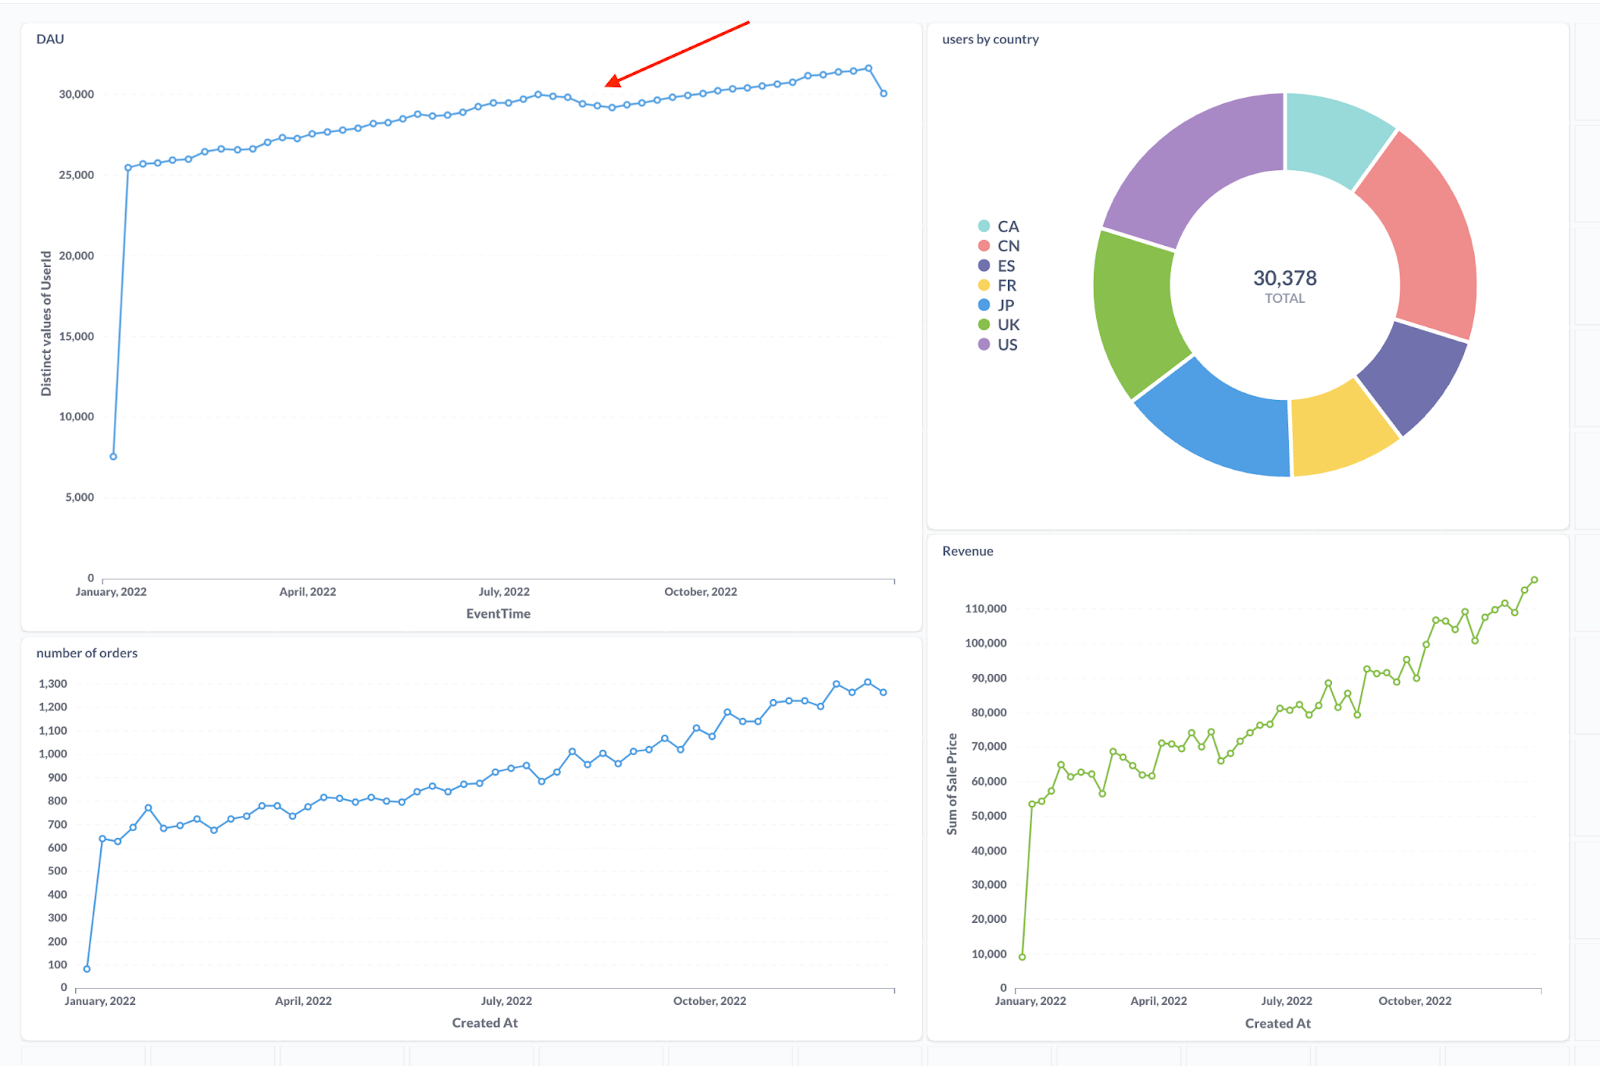
Why was there a DAU decrease in August? Think about the hypothesis you need to run through.
Solution:
DSensei replaces the manual work by employing statistics and AI technologies to holistically analyzes all the segments, group the correlated ones together, and indicate the ones that are the key drivers of the metrics fluctuation. The whole process only takes seconds to minutes depending on the dataset. With these swift insights, organizations can gain a comprehensive understanding of the underlying reasons behind metric fluctuations and promptly devise action plans.
Besides the improvement in the time to action, DSensei enables users to make sense of granular segments, complementing traditional BI tools which lack the ability to drill down into the details of that data. By revealing hidden insights from these data segments which are typically invisible to conventional tools, DSensei empowers users to gain a deeper understanding of their data, which leads to more comprehensive and informed decision-making.
You can see the reason behind the DAU decrease was that there was a sharp DAU drop in old Android devices, which is probably caused by a crash of a new release. And because DSensei has listed out all the noticeable segments, you’re confident that there are no other factors to concern.
Asks
- Check the online demo with your dataset or the sample dataset provided
- Follow our GitHub repo: https://github.com/dsensei/dsensei-insight/
- If your company is seeking a tool to enhance data-informed decision-making, contact us at founders@dsensei.app. We would love to chat to make DSensei work for your use case