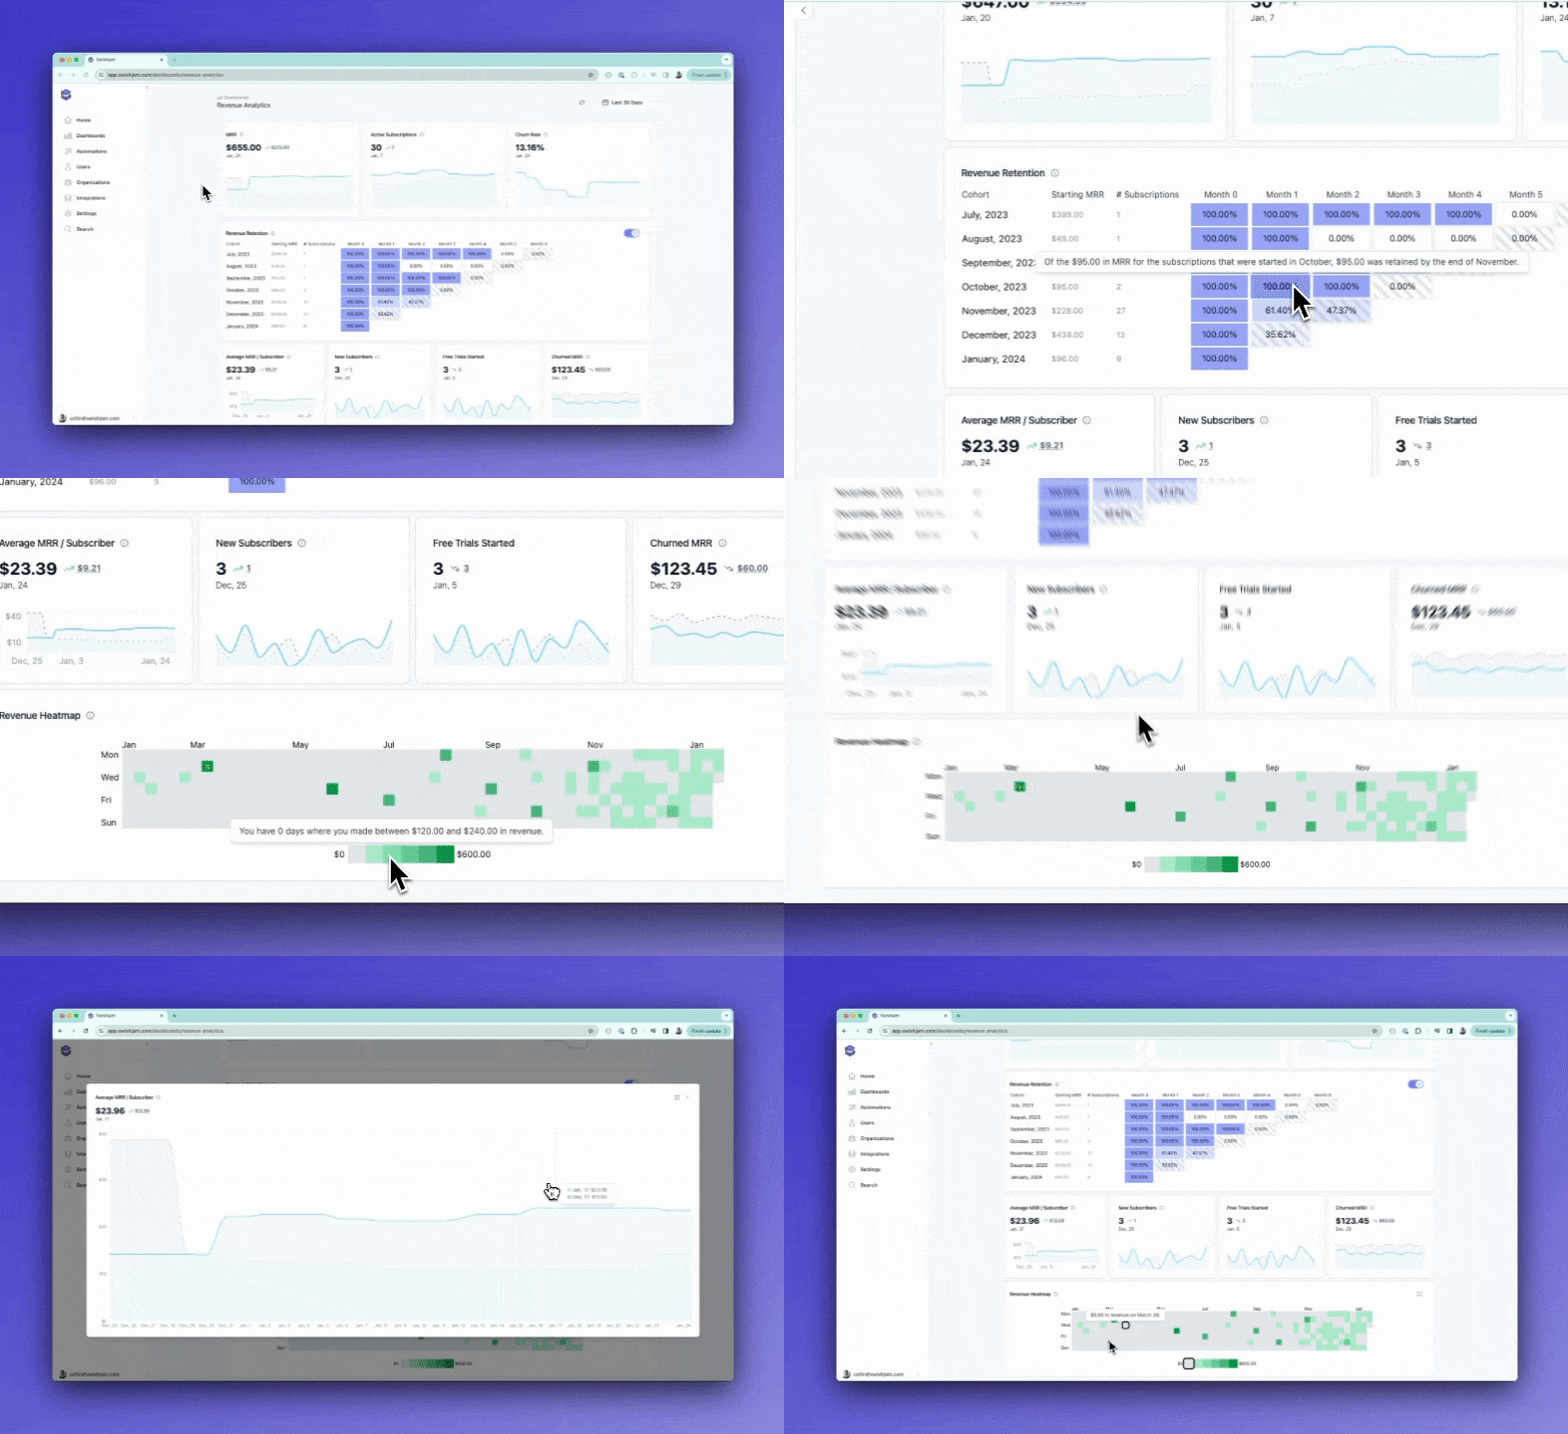
Revenue Analytics by Swishjam — Connect your product usage data to revenue
Pull in all of your core SaaS-related revenue metrics into a single dashboard to enable you to better understand your business and keep track of what matters most; your revenue.
Swishjam’s Revenue Analytics solution pulls in all of your core SaaS-related revenue metrics into a single dashboard to enable you to better understand your business and keep track of what matters most; your revenue. Most importantly, your revenue is now automatically connected to your user’s product usage.
How does it work?
Swishjam connects to your Stripe account, syncs your data, and calculates all of your most important SaaS-related revenue metrics such as MRR, churn rate, revenue retention, and more.
When you enable Revenue Analytics in Swishjam, you get:
1. Revenue Analytics Dashboard - data visualizations of all your key revenue metrics.
2. Automations & Slack Notifications - because Swishjam is now ingesting your Stripe events as they occur in real-time, you can set up automations to take actions when important revenue-related events occur.
3. Reporting - Get daily/weekly/monthly reports on your revenue in Slack or by email.
4. User Profiles Tied to Revenue - we automatically tie user profiles from your product analytics to Stripe data. This lets you build a better picture of your customer without lifting a finger. We also roll up this data to organizations if your app has that type of billing. Coming in version 2 is the ability to predict churn from this data and catch zombie users before they churn to keep more of your hard-earned customers.
Why is this exciting?
Sure, lots of other apps already have this type of dashboard but none that we know of can tie this type of information together easily. Currently, it’s quite painful and most usually a manual process. This is also a big step towards our larger mission of tying your disparate data sources into your product analytics data as a first-party citizen, automatically stitched to your user profiles, and creating a true 360 user profile. What this means is that within Swishjam, you will be able to easily sift, segment, and visualize all of your product analytics data along with your billing data (and other data sources!) to answer questions like:
1. Which of my users’ usage is dropping off who are subscribed to the Gold Plan?
2. What percent of users on the Free Trial trigger the {your aha moment} event?
3. What were the usage patterns for user XYZ leading up to their churn?
Interested in getting access? Drop us a line at founders@swishjam.com and we’ll get you up and running in a few clicks.
